Check out our White Paper Series!
A complete library of helpful advice and survival guides for every aspect of system monitoring and control.
1-800-693-0351
Have a specific question? Ask our team of expert engineers and get a specific answer!
Sign up for the next DPS Factory Training!

Whether you're new to our equipment or you've used it for years, DPS factory training is the best way to get more from your monitoring.
Reserve Your Seat TodayAnalog inputs are a great way to keep track of your sites. You can monitor precise voltages, fuel levels, temperatures, humidities and more. Analogs paint a much clearer picture than discrete contact closures.
The problem comes when you try to ask a historical question, like:
It's impossible to answer these questions accurately without gluing yourself to your screen 24/7. Unless, of course, your RTU supports analog trending and graphing.
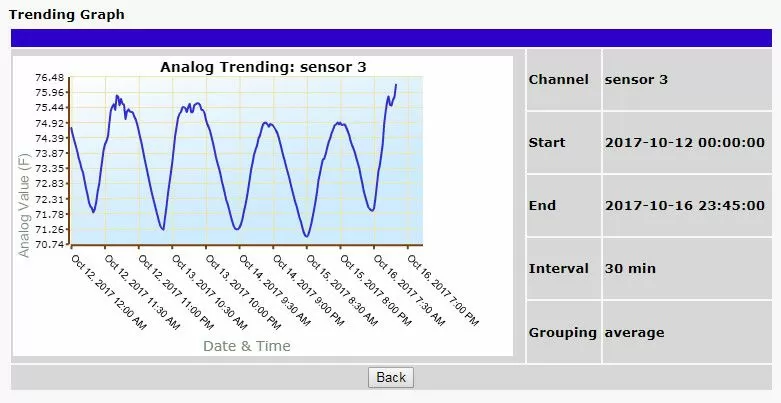
Trending is a massive help for multiple reasons - It makes the invisible become painfully obvious. With trending and analysis, you can see:
Some monitoring devices have analog trending capabilities built into their web interface. If you have this feature, then you're ahead of the game. The next step is utilizing them to understand your analogs and overall network health.

Looking at raw analog trend data is a good first step, but it is still easy to miss something. Using graphs to visually represent analog data can make trends and potential problems stand out like a sore thumb.
Once you have a graph, some devices also allow you to export history as CSV. You can use Excel to create report, or import the data into SQL server for further analysis or raw queries with the tool of your choice.
URL-based CSV retrieval allows you to write a recurring cron job to extract a CSV on a regular basis (ex. daily), so you are always collecting and logging events and storing them in your company's central server (ex. SQL). GET parameters can be used with the history.csv or the eventlog.csv request to filter the returned data. When no GET parameters are supplied, all data will be returned in CSV format.
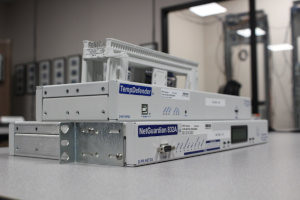
Some devices from DPS Telecom, like the TempDefender G2, allow you to export data as a CSV.
This is an example from the TempDefender G2 user manual. By adding certain variables to the end of the IP address of your RTU device, you can request a customized CSV with the exact data you want. For more information, view the user manual.
CSV Export Example: http://192.168.1.145/history.csv?st=1397669439&et=1397671119
(In this example, we've requested all of the history events that occurred between two timestamps in UNIX format)
CSV export sample parameters:
| Parameter | Description |
| ch | Channel number 1-40. If present, filters for a particular channel. Analogs are mapped to channels 1-8, Sensors are mapped to channels 9-40. history.csv |
| cnt | Row limit. If present, device will return "cnt" most recent lines. |
| st | Start time in unix time format. This will limit number of lines returned. |
| et | End time in unix time format. This will limit number of lines returned. |
It's also very easy for your IT team to write a cron job that will request, receive, and process a CSV at regular intervals. Once you've captured data in this way, you can analyze it using any of your favorite tools.
It's unfortunate, but insights you get from weeks and months of data logging don't happen unless you started logging data weeks and months ago. Don't wait any longer to start logging, graphing, and learning from your network alarm data.
At DPS, we receive many urgent quote requests after an earlier "Do Nothing" decision comes back to bite you. You have no reason not to be proactive (and maybe you'll manage to impress your boss).
Call us. Chat with an expert for 10 minutes. We'll email you a detailed quote with a custom application drawing. We'll even include a summary of business benefits you can use to justify your project budget.
Call 1-800-693-0351 now for your quote
(or send us a quick online message instead)