Check out our White Paper Series!
A complete library of helpful advice and survival guides for every aspect of system monitoring and control.
1-800-693-0351
Have a specific question? Ask our team of expert engineers and get a specific answer!
Sign up for the next DPS Factory Training!
Whether you're new to our equipment or you've used it for years, DPS factory training is the best way to get more from your monitoring.
Reserve Your Seat TodayOur T/mon is a powerful, comprehensive, all-in-one alarm master that provides visibility to all your remote sites in a single platform. It is our solution to the issue of legacy protocol support, bringing all your devices' alarms to one location.
We didn't stop there, however. With GFX, you can create map views that help you identify the physical location of where an alarm is coming from. We built GFX to save you from massive amounts of windshield time, allowing you to strategically dispatch technicians who are closer to the problem.
Finally, and what we will be covering in this article, is the ability to monitor the environmentals of your remote sites straight from your T/Mon!
I will cover the basics of NetGuardian sensors and connecting D-Wire Sensors, as well as how to connect your NetGuardian to a T/Mon. And, finally, visualizing those sensors straight from your T/Mon.
If you're new to T/Mon and have ventured to do this, you've no doubt run into something that looks like this:
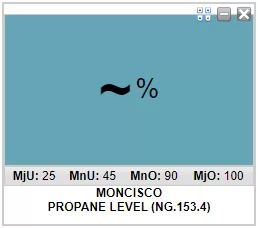
It's a bit of a head-scratcher at first, but by the end of this article, you'll be equipped with the knowledge to repeat this process successfully every time you need to add more devices and sensors.
Sensors allow us to monitor things beyond simple binary on-off events. Events such as temperature, humidity, air flow, etc. that the T/Mon can then process and provide trend graphs over time.
Our units are configurable to sport an internal temperature to help get you started with sensors. Alternatively, we build our own sensor, called a D-Wire Sensor.
D-Wire Sensors monitor an array of environmentals like the ones mentioned above. They're designed specifically for NetGuardian compatibility. Now, you may or may not have a D-Wire Sensor, but we will still cover them. So, let's get started.
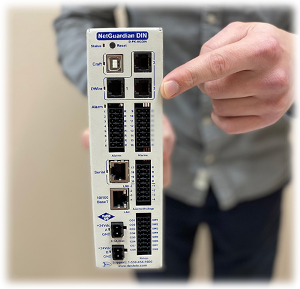
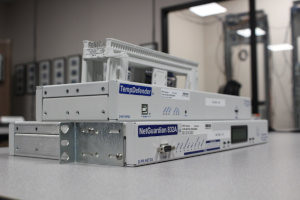
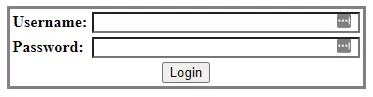
First, we will launch our NetGuardian's web interface. In a web browser, you can navigate to your RTU's IP address in the URL bar. For this example, I'm going to be using our TempDefender—a highly capable RTU with more than enough D-Wire ports for this example.
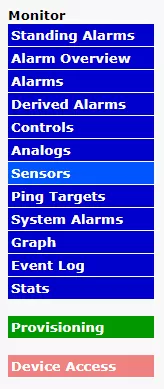
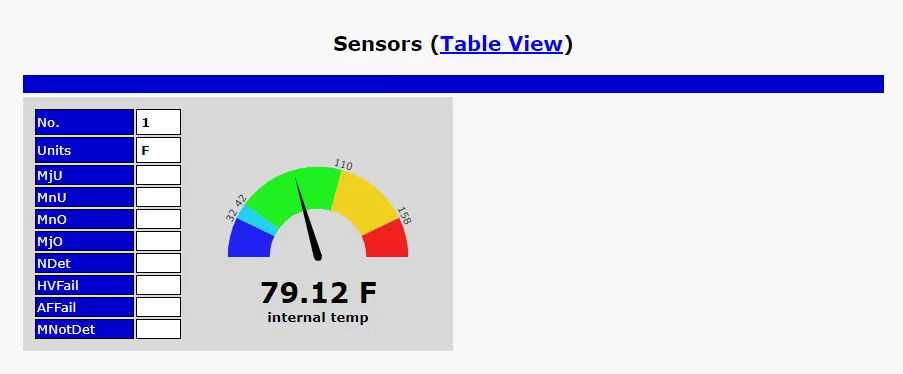
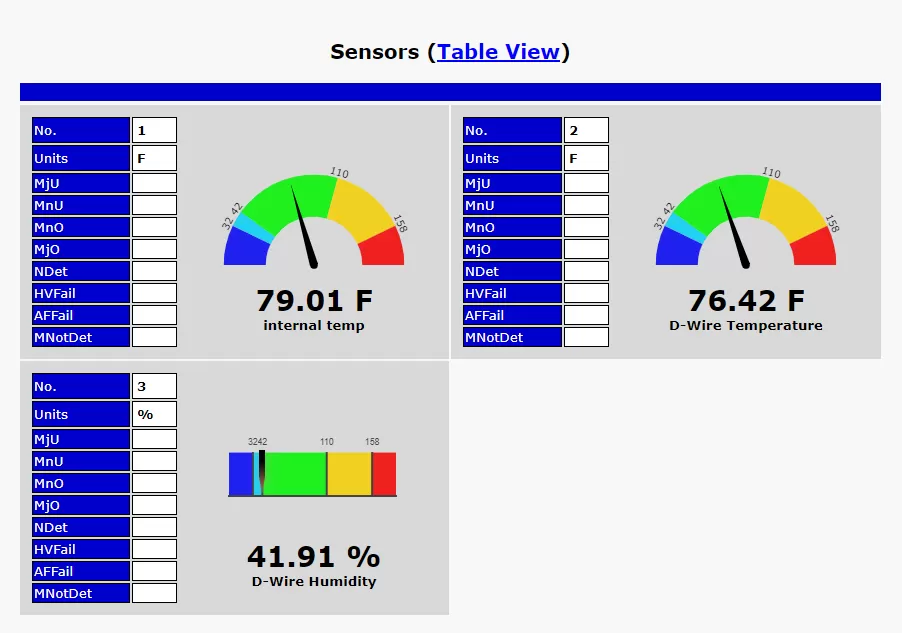
If your RTU already has an onboard sensor for internal temp, you can view the sensor right away by clicking the "Sensors" button in the left-hand navigation.
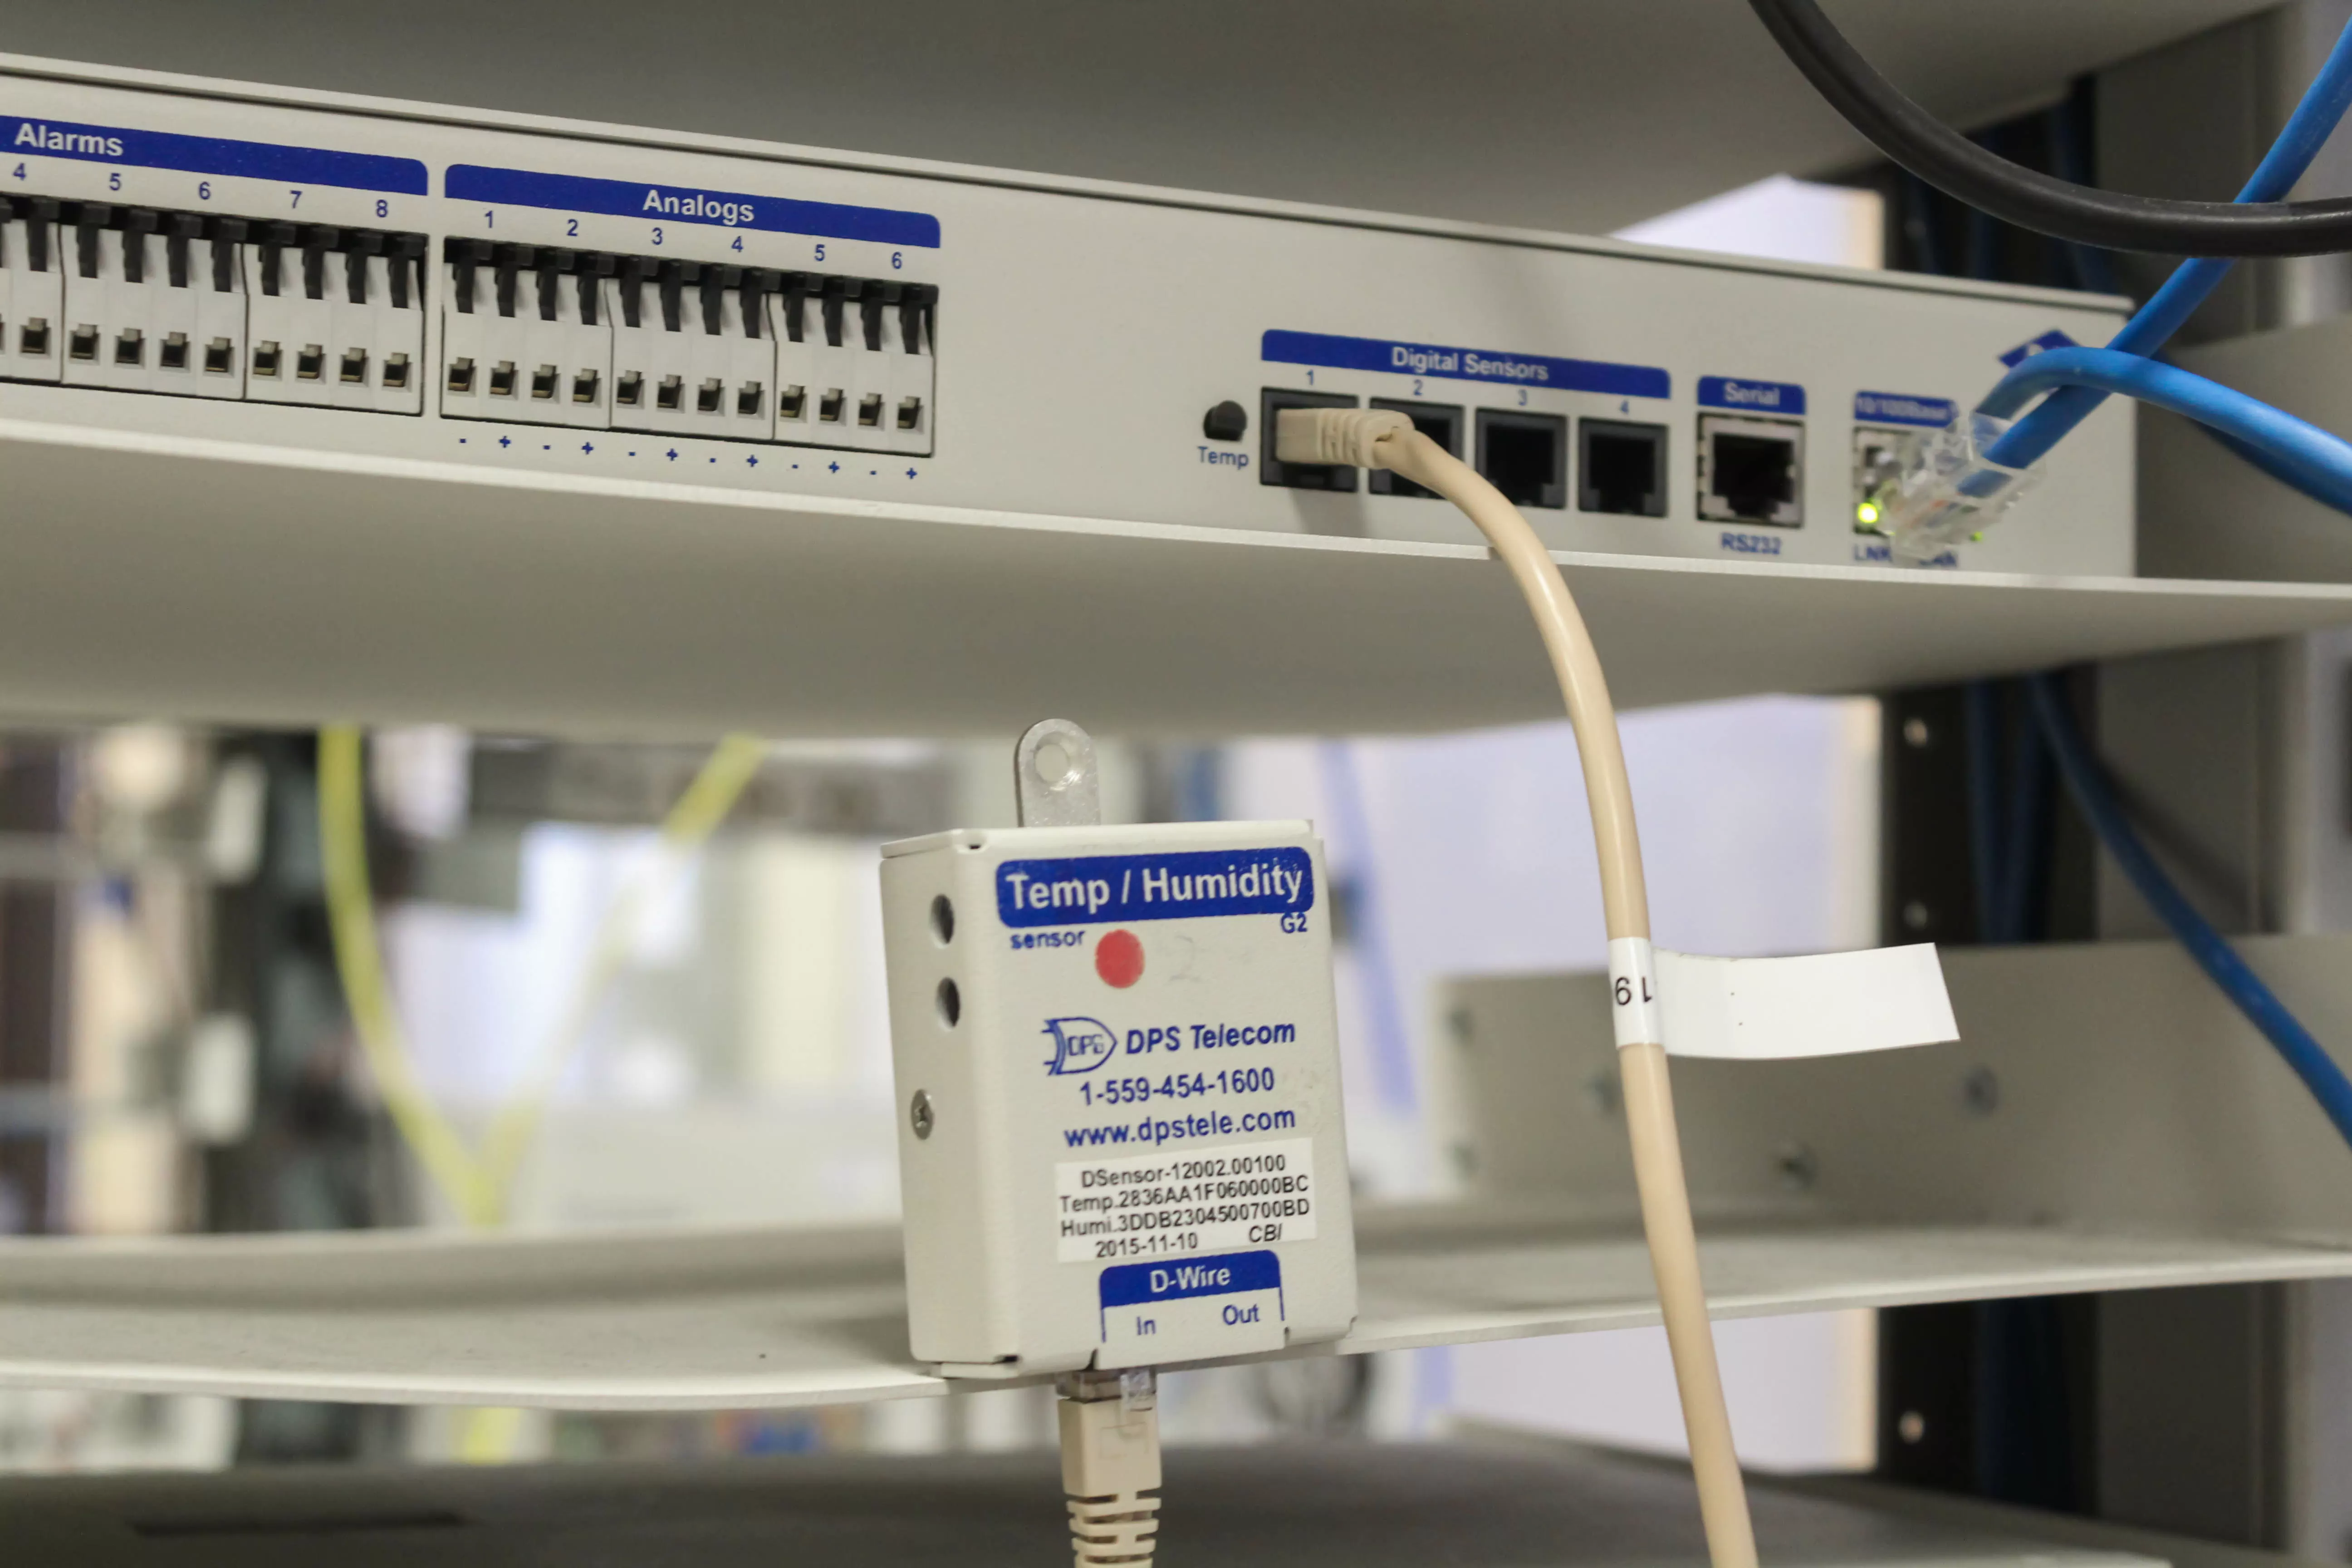
Now that we know how to view our sensors, let's go ahead and configure an additional sensor. In the left-hand menu, we will click "Provisioning" this time, then click "Sensors". With our D-Wire Sensor plugged in, we can see that it's been connected, but not configured. You'll notice two sensors as this one I have plugged in is a temp/humidity combo.
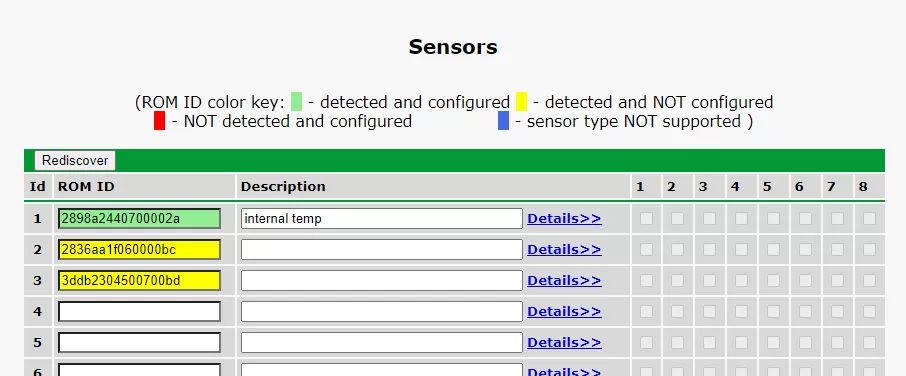
Note: a ROM ID that starts with "28" is a Temperature sensor, and a ROM ID that starts with "3d" is a Humidity sensor.
Once we configure the sensors by giving them a description, we can then go back to monitor mode to see our new sensor.
Now that we have our sensors configured, we can begin the process of polling our NetGuardian with a T/Mon. Let's first prepare our NetGuardian to be polled by our T/Mon.
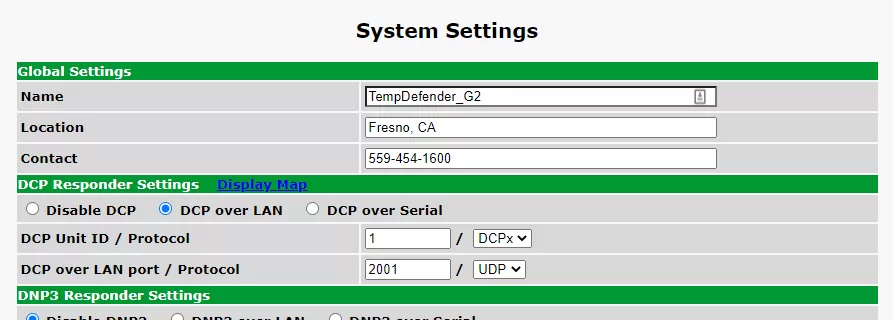
Under the Provisioning menu, click "System". Under the "DCP Responder Settings", be sure to select the option "DCP over LAN". Go ahead and also set the DCP Unit ID / Protocol to 1 and DCPx. You can leave the LAN port alone unless you have some conflicting port open.
Go ahead and save your changes, and then we will start on the T/Mon. Open a new browser tab and navigate to the IP address of your T/Mon, enter your user credentials, and then click the "Edit" button.
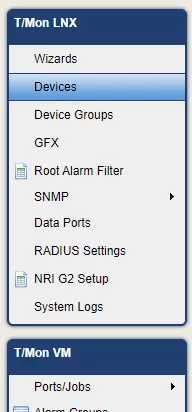
In the left-hand menu, click the button labeled "Devices".
We will be taken to a tree view of all our devices. You can expand each folder by double-clicking, or by simply clicking the plus button.
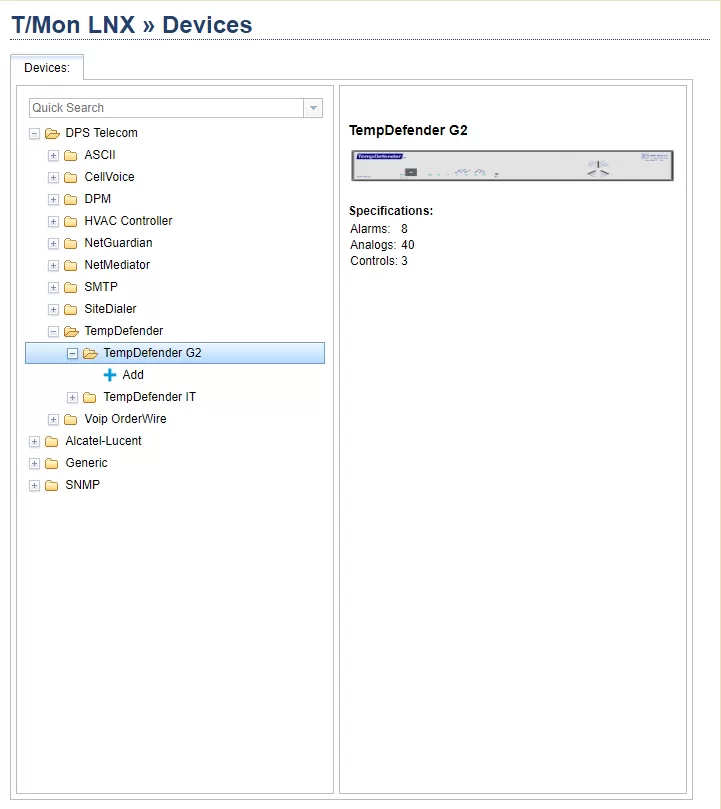
Go ahead and give your NetGuardian a meaningful name (such as its location) and click "Ok". You'll then need to double-click on the name of the device to open its preferences.
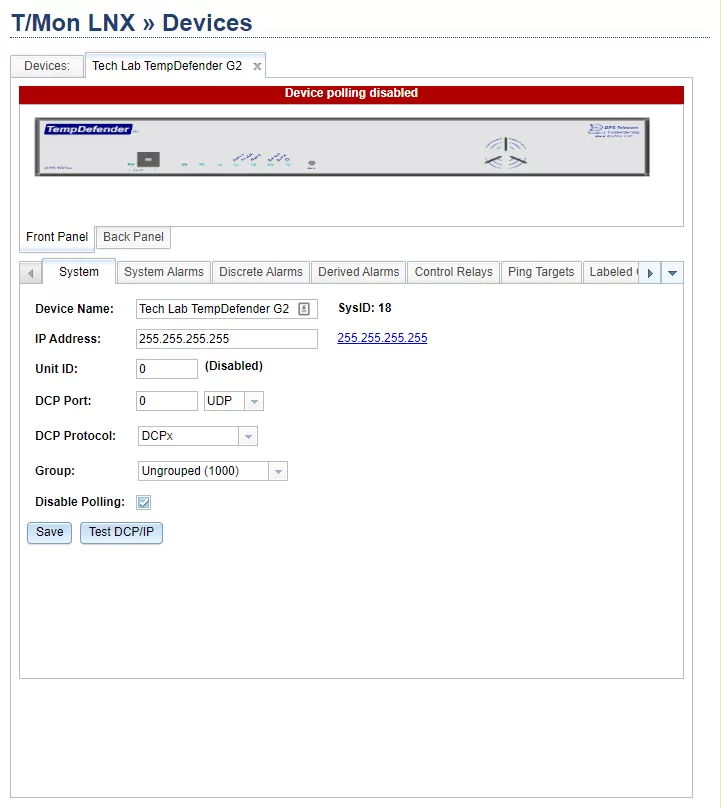
Change the IP address to the IP address of your device, and then set the Unit ID to 1. Finally, uncheck "Disable Polling", then click the button labeled "Test DCP/IP".
On newer versions of T/Mon, you can sync to and from the RTU. Below the System configuration, look for a button labeled "Sync From Device".
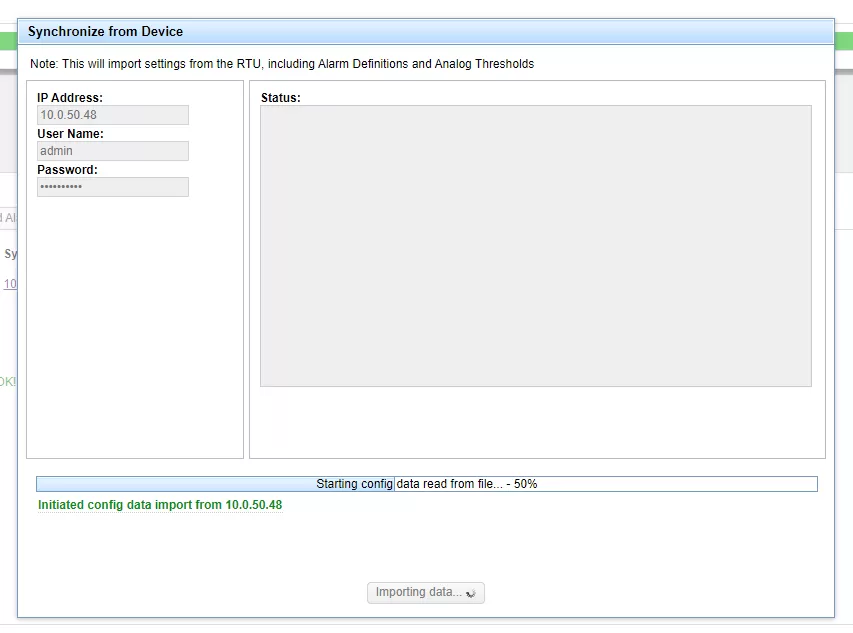
This transfers your alarm descriptions, thresholds, and more from your NetGuardian and imports it into your T/Mon so that both can share the same data so that you don't have to reconfigure each alarm point. Once the transfer is complete, be sure to hit the "Save" button one more time. You will need to save on each red-colored tab.
Now that our RTU is set up on our T/Mon, we can move on to Monitor Mode. In the top nav bar, click the button labeled "Monitor". This usually opens a new tab.
In the left-hand tab menu, go ahead and click on "Analog Groups". You may already have a couple configured like I do.
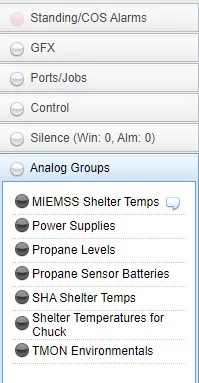
In my case, however, I do not have an Alarm Group created that best suits the physical location of this unit. So, I'll go ahead and create one! In the top nav bar, I'll click "Analog", which exposes a drop-down. Then I'll click "Create Analog Group", and I'll call it "Tech Lab".
Upon clicking "Create", I can see my new Analog Group in the left-hand menu under the Analog Groups tab. Then I'll need to add my device to this group. Up to this point, I have yet to see The Tilde.
Let's begin adding some analogs to this view. Just below the Analog Group tab to the right of the menu, click on "Edit Group". Select your device from the drop-down and look for the sensors you had configured earlier. They should be easy to find since we synced our sensor descriptions from the NetGuardian.
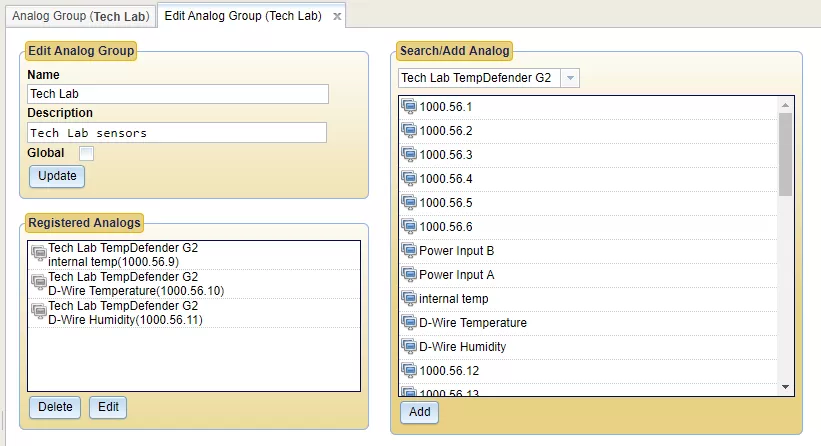
You can then double-click or drag-and-drop the alarm point that you wish to monitor. As you can see, I've registered the internal temperature, as well as the two sensors provided by the D-Wire. Now, in the top tabs, click the left-most tab, which is our new analog group.
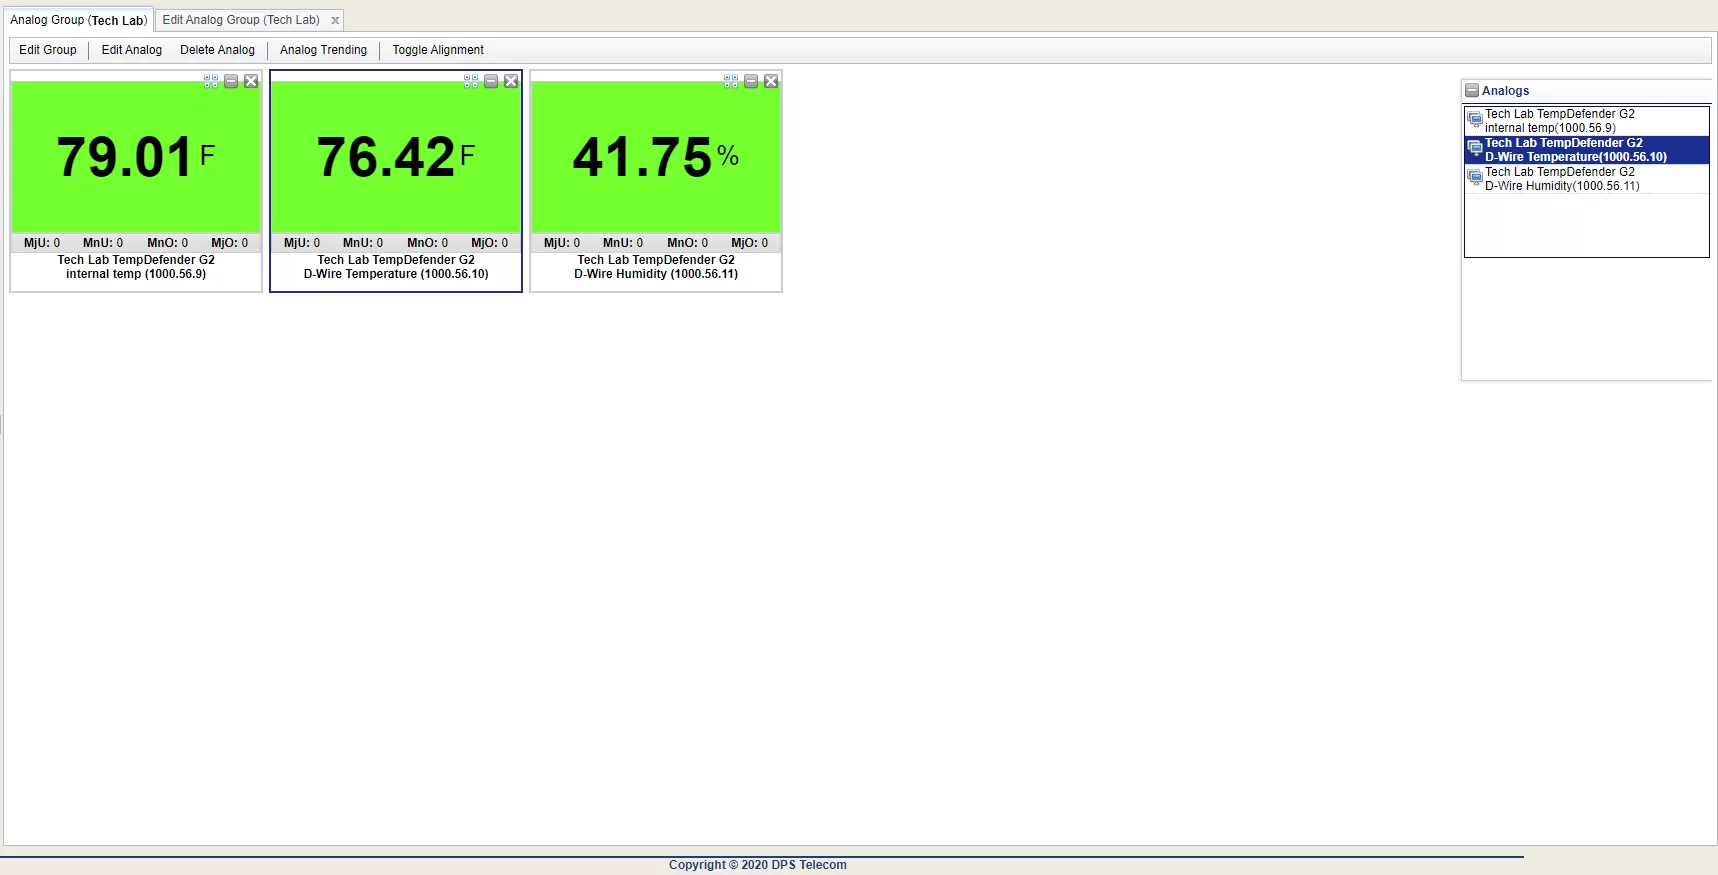
To the right, you will see our registered analog sensors, but they appear gray. They will darken once they are active in the display. You can activate these analog sensors by double-clicking or dragging and dropping the analog onto the main display.
With our device properly polling and configured, and once our analogs are activated, we can now see these analogs and their values in our main display.
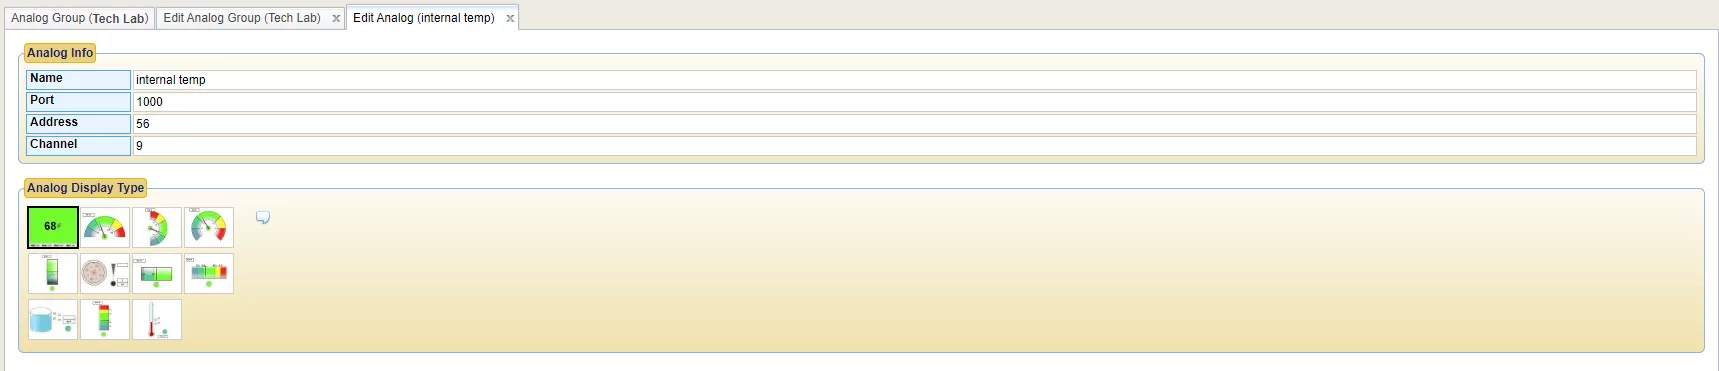
To go a step further, I would really like for my sensors to display like I had them in my TempDefender. To change the gauge style of a sensor, click the sensor to focus it, then click "Edit Analog".
But what happens if I've followed these steps exactly and am still seeing The Tilde? What could be happening is you may be using an outdated device module.
For example, take a look at my analogs above. I can see that my internal temperature is located at 1000.56.9. Now, if I were to use this same device on another T/Mon (please disable polling on the current T/Mon first) that I know is using a potentially older device module, I can see that my internal temperature is trying to read from 1000.49.9.
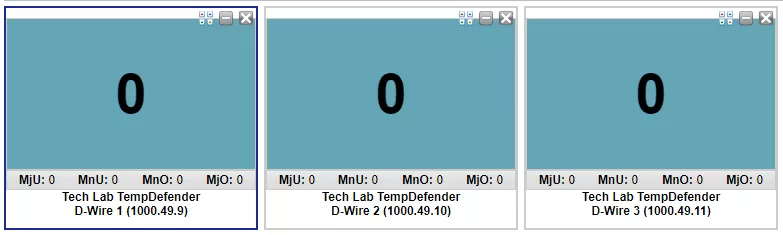
As our devices are updated, there is the potential for the Display Map to change. Therefore, it is always best practice to update your DPS device modules on your T/Mon whenever you upgrade the firmware of your RTU's!
In this article, we walked through how to set up sensors on a NetGuardian, connecting our NetGuardian to a T/Mon, and finally how to visualize those same sensors on our T/Mon.
At DPS, we know remote monitoring. We understand how imperative it is to be able to see all your devices in one place. That's where T/Mon comes into play. This versatile, powerful platform makes it easy to mediate all your legacy devices, saving you money where another platform may cause you to spend massive amounts of money on infrastructure upgrades.

Julian Coleman
Julian Coleman is a Software Engineer at DPS Telecom. He is responsible for maintaining internal tool systems and improving website UX.