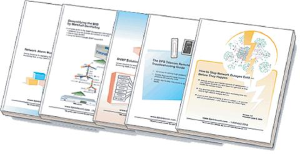
Check out our White Paper Series!
A complete library of helpful advice and survival guides for every aspect of system monitoring and control.
1-800-693-0351
Have a specific question? Ask our team of expert engineers and get a specific answer!
Sign up for the next DPS Factory Training!
Whether you're new to our equipment or you've used it for years, DPS factory training is the best way to get more from your monitoring.
Reserve Your Seat Today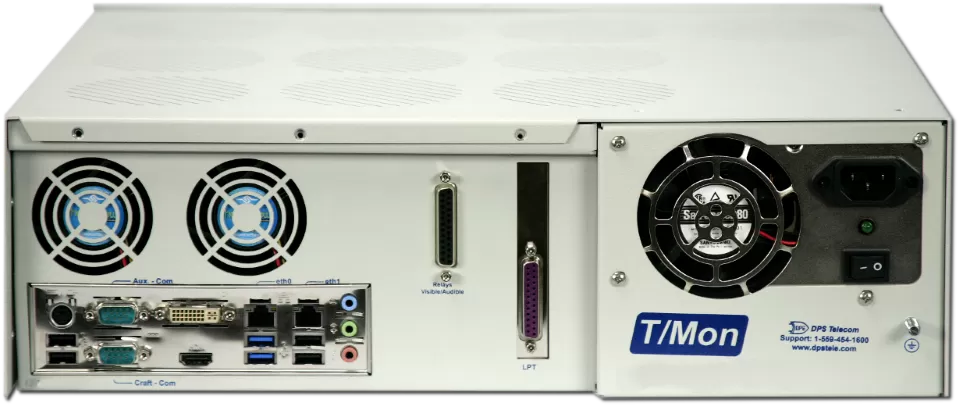
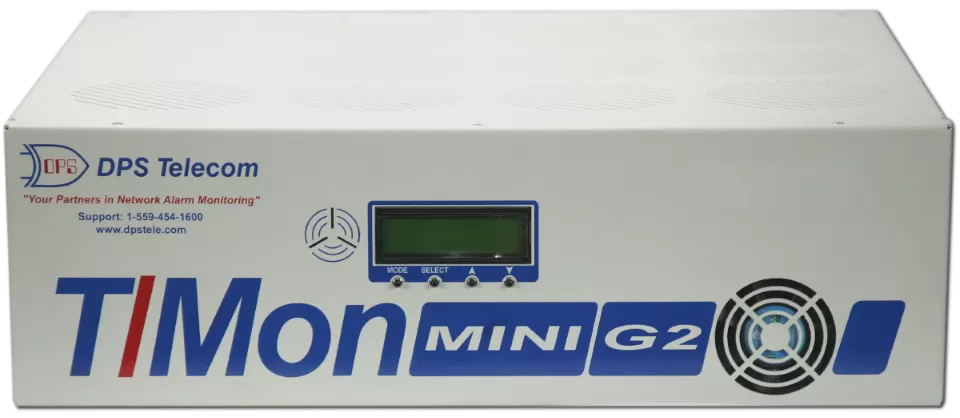
T/Mon MINI is a complete network alarm monitoring system in a compact package. It’s the full power of the full-scale T/Mon LNX Alarm Monitoring System, scaled to the needs of small networks.
The T/Mon MINI Remote Alarm Monitoring System puts control over your alarms directly into your hands. T/Mon MINI is a unique version of the T/Mon Remote Alarm Monitoring System, scaled to the needs of small and medium networks that only need to monitor DPS RTUs.
Cost-effective and easy to install, T/Mon MINI puts high-quality, centralized management of DPS RTUs within the reach of any company. T/Mon MINI gives you the advanced alarm monitoring capabilities of a full-scale T/Mon, at a scale suitable for managing your local or regional network.
You can use T/Mon MINI to:
T/Mon MINI is a new smaller-scale master station for networks with just a few sites. If you have dozens of sites rather than hundreds, T/Mon MINI may be right for you. MINI includes the same clean web interface as a full-scale T/Mon. You also get T/GFX mapping software.
Automatically Control Remote Site Equipment
T/Mon MINI's derived control formulas automatically issue control commands in response to alarm inputs. This requires no human intervention. The T/Mon MINI fully supports control relays. That includes relays connected to legacy RTUs.
Graph and Analyze Alarm History
T/Mon MINI records up to 999,999 system events. These can be viewed in a variety of report formats. Alarm information can also be exported as ASCII text. That can be sent to an after-hours recording device or imported into a database or spreadsheet program. From there, you can use the data for graphing and analysis.
T/Mon GFX combines the power of T/Mon with an intuitive MapPoint interface
T/Mon's customizable displays present network events in plain English and geographic maps, in terms that your staff will immediately understand and take action on. The T/Mon interface is easy to use and ensures that system operators will have the right information to take corrective action in an emergency.
With T/Mon GFX, any PC anywhere on your network can become a complete T/Mon monitoring station, with the full power of monitoring and acknowledging alarms, operating control relays, and generating reports for in-depth analysis of network events.
Floorplan View - T/Mon GFX
You'll upload your own backgrounds and maps in T/Mon GFX to customize the way you view alarms. This example shows a drawing of a floorplan, with alarm icons associated with specific rooms within the building for a drilled-down view.
Change of State - Immediate Notification of New Events
The COS screen displays alarm points that have changed from Normal to Alarm, or vice versa. You don't have to hunt to find out what has changed in your network - the COS screen lists it for you. Here you can also acknowledge alarms.
Standing Alarms - All Current Alarms
The Standing Alarm list is continually updated to show all currently failed alarms.
Text Messages - Give Specific Instructions to NOC Staff
The COS and Standing Alarm screens feature Text Messages that give specific instructions for correcting specific alarms. Everyone on your NOC staff, even without extra training, will know precisely what to do and who to call in case of an alarm.
Trouble Log - Record What's Been Done to Correct Alarms
A Trouble Log window can be accessed for each alarm. NOC staff can record what corrective action has been taken, keeping clear documentation of what has been done.
Device Status - Display Polling and Control Network Elements
The Device Status screen shows all the alarm elements on a given polling leg along with their current status. This screen may also be used to take devices on/off the line and access device-specific function.
Labeled Controls - Easy Control of Remote Site Devices
The Labeled Controls screen gives access to devices at specific remote sites. Just highlight the control and select.