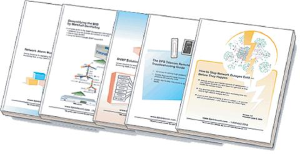
Check out our White Paper Series!
A complete library of helpful advice and survival guides for every aspect of system monitoring and control.
1-800-693-0351
Have a specific question? Ask our team of expert engineers and get a specific answer!
Sign up for the next DPS Factory Training!
Whether you're new to our equipment or you've used it for years, DPS factory training is the best way to get more from your monitoring.
Reserve Your Seat TodayDo you have a SCADA system and are trying to determine the root cause of issues with your processes or are trying to improve your network productivity? Then comparing your alarms over time can be really revealing.
With trend analysis your past data can be used to help predict the future. In SCADA systems, this process involves comparing alarm data over time with the objective to identify certain patterns, also known as trends.
Modern SCADA devices are able to give you an intuitive trend analysis tool to deliver actionable insight to you or to your network technician. This will give you the ability to immediately change processes and conditions in order to achieve your goals.
If you are in charge of a remote monitoring system, it's important to explore the benefits of analyzing alarm and trend information to understand the real cause of problems. It's also important to understand the importance of using the right SCADA device to make such analysis possible.
So, let's dive in.
You might agree with me when I say that remote monitoring and control systems are only as useful as the actionable information they provide.
This is because collecting a large amount of data has no use unless it is organized and accessible in a way that allows you to receive usable insight from your SCADA system. After all, most organizations have facilities located at remote sites where conditions can be harsh and unpredictable.
Also, depending on the size and complexity of your network, your technicians might get caught up in simply managing the high traffic of information coming in - instead of analyzing this data to obtain relevant insight over your network.
Even if you have modern SCADA tools, digging deeper into your operations sometimes is too difficult to do in the midst of all other responsibilities you or your techs might already have. As a matter of fact, it's uncommon for a technician to leverage all the potential their SCADA systems can give them.
The benefits that could be achieved by simply analyzing are lost between the high volume of information coming in from your remote equipment. Usually, it's not the lack of data that is the problem, but being able to link diverse data points stored in the master station (that, if put together, could show underlying patterns and the root cause of issues).
When you compare one set of equipment alarm data over a period of time you can get useful insight over your network. This comparison can help you in a number of ways:
To some extent, even potential network failures can be avoided if, when notified about an alarm, the technician can quickly scroll back in time to see the alarm-trend of the recent past to find out anomalies and root causes. You or your tech then will be able to appropriately respond to the alarm before any escalation.
With data analysis capabilities, troubleshooting becomes a proactive action instead of having to react to a full-blown failure. If your SCADA tool can show you not only the alarm and trend information but also your technician's response to those alarms, then the analysis will give you a whole new level of insight into operator effectiveness as well as areas of attention in your system.
In order to compare alarm data to find trends, usually network technicians locate alarm logs and compare them with each other over a certain period of time. This can certainly be efficient, as long as you are dealing with a small, simple network.
Typically, and especially for larger networks, the best practice is to deploy a SCADA master station with built-in analysis capabilities. They will be able to automatically store and cross-reference your alarm data according to the period of time you need to take a look at.
These devices are normally capable of giving you a spreadsheet that you can download to your workstation in order to further study the trend data.
Imagine how hard it would be for you to determine a clear association between alarms conditions if you have to look at them separately. That's why it is critical that you find a SCADA master station that is able to "join the dots" on a single screen.
How does this help?
You or your technicians can intuitively spot linkages when alarms and trend data are brought together in an integrated interface. This can also help improve your productivity and alarm response time, since all you only have to depend on a single display to have visibility over your network - you won't have to deal with many different master stations.
Also, an efficient visualization of an overall network trend analysis can, when used appropriately, help you to go forward in terms of knowing what to expect in terms of processes parameters for upcoming conditions. So, according to your historical and real-time SCADA information, you can monitor your all network based on what your processes and equipment conditions should look like.
Think about a child picking up a single piece of a jigsaw puzzle and trying to unsuccessfully to understand it without taking into consideration the rest of the puzzle pieces. Now, think about a child placing all jigsaw puzzle pieces out on a table and then connecting seemingly unrelated pieces together to make a meaningful whole.
In a SCADA environment, having people performing their own analysis is much like the first scenario. It's impossible for your technicians to memorize all the important information related to what you are trying to find out. You'll ultimately be looking at one single piece of information that won't give you complete visibility.
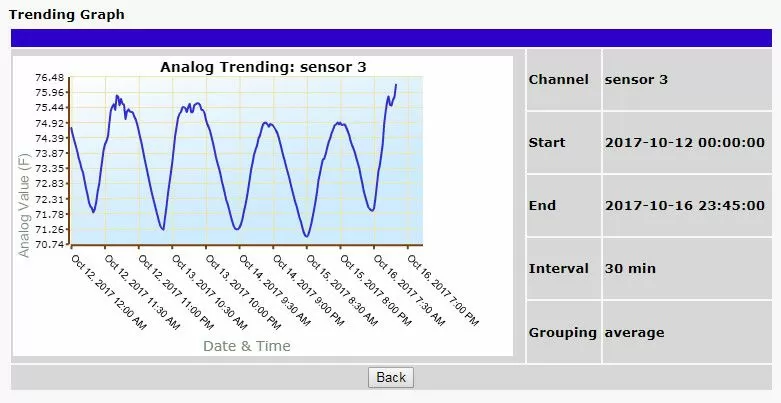
Instead, the best practice is to make sure your SCADA master station is able to store all your alarm information throughout the years and allow you to access all this data in a graph format. Graphs is an efficient way to see when an occurrence happens outside the expected line.
If you are able to automatically perform trend analysis with a single click of a button, you'll be able to detect any potential issues and proactively protect your network.
Finally, if your SCADA master station has preconfigured features, saved view or favorite view options, then network operators don't have to spend time customizing the most common views that they keep going back to each time.
Ultimately, an efficient SCADA master station will make data analysis easier, quicker, and more intuitive for your technicians and for any other person involved with monitoring your network. Without a trend analysis tool, you would have to rely on what one your techs think is a useful insight.
Usually these insights are not efficient enough to be turned into an actionable response. And if your tech doesn't know how to fully work with your SCADA system, the chances of having proactive visibility are lower. Having a perfect-fit SCADA tool will provide you with:
One such tool is the T/Mon LNX master station. It brings together timestamped alarms and trend data in an integrated display. With this master station, technicians that in the past didn't analyze as much as they could have liked to will now be encouraged to perform analysis on diverse data on an intuitive display. This will they will be able to act sooner and more effectively to minimize problems.
Importantly, users can analyze data without the need for programming help and the time saved in analysis can help towards other tasks - enhancing the overall efficiency and productivity of operations. With T/Mon, data values can be compared across different time periods, historical data can be retrieved, flexibility in the level of detail is offered in the form of the zoom feature, and customization options beyond data to the format, style, icons, and colors of displays.
Also, you can export and save any of your alarm reports to your computer or workstation.
Most environments that SCADA systems need to remote monitor and control are complex and demanding, so reliable visibility is really important. However, not all networks are made the same. Yours might be so particular that you probably are still wondering if you need trend analysis capabilities.
If that's your case then you need to evaluate your network and current set up. This can be done by asking yourself the following questions:
By answering the previous questions you can make sure if it's time for you to invest in a SCADA device with analysis capabilities that will ultimately leverage your system.
Trend analysis can help you enhance your SCADA system efficiency by helping you to identify areas within your network that are doing well, as well as areas that are not doing well. So, analyzing your network will provide you with valuable evidence to help you make informed decisions.
However, the success of your SCADA predictions will depend on the accuracy and competence of the data, the frequency of data collection, and having the data in an easily accessible and usable format. This means that your trend analysis will be as useful as your SCADA master station.
So, it's critical that you invest in a master station that you can truly rely on. A competent device that will give you full visibility over your network.
Our expertise with SCADA systems makes us the ideal partner to assist you with an efficient master. We know that to have a SCADA system that you can fully trust, it needs to be customized to attend your unique needs. So, that's what we do. We evaluate your requirements and design your perfect-fit monitoring device.
Want to find out more? Then reach out to us to discuss how we can develop a system to suit your specific needs.

Morgana Siggins
Morgana Siggins is a marketing writer, content creator, and documentation specialist at DPS Telecom. She has created over 200 blog articles and videos sharing her years of experience in the remote monitoring industry.